
Last Updated: October 30, 2026
Quick Summary
Primary consumer population data tells you how many herbivores or other first-level feeders live in an ecosystem and how that number changes over time. Size, abundance, and density are the core measures, and reliable datasets depend on matching the sampling method to the consumer and recording sampling effort.
- Size is total individuals; abundance is counts per sample; density divides counts by area or volume.
- Match the method to the consumer, such as quadrats for sessile species or pitfall traps for mobile invertebrates.
- Record effort for every sample, such as trap-nights, sweep seconds, or plot area, so counts stay comparable.
- Account for autocorrelation, since consecutive years often depend on each other and can make trends look more certain.
- Check design, taxonomic resolution, effort, license, and version before downloading any primary consumer dataset.
Table of Contents
- What Primary Consumer Population Data Measures in Ecology
- Choosing the Right Primary Consumer Data for Your Research Question
- Ecological Population Sampling Methods for Primary Consumers
- Estimating Population Size in Ecology: Metrics and Methods
- Building a Consumer-Resource Population Model
- Data Quality, Sampling Bias, and Autocorrelation
- Where to Find Datasets and Your Next Research Step
- Frequently Asked Questions
Primary consumer population data for ecological research tells you how many herbivores or other first-level feeders live in an ecosystem, and how that number changes over time. Accurate Market Research, a full-service international market research firm, helps organizations turn field data into decisions they can defend. The same discipline applies in ecology: a count is only useful if you know what it measures and how it was collected.
What Primary Consumer Population Data Measures in Ecology
Primary consumers are organisms that feed directly on producers, such as plants or algae. Read a fuller definition of primary consumers and their ecosystem roles. Population data describes how many of them exist, where they are, and how their numbers shift. Researchers use this information to understand the wider community, not just one species.
Population size, abundance, and density
Population size is the total number of individuals in an area. Abundance is a related count, often used for comparisons across sites. Density divides that count by area or volume, which makes results comparable when sampling units differ.
- Size: total individuals in the study area
- Abundance: counts per sample or per site
- Density: individuals per square meter, liter, or trap
Paleoecological work shows how these measures are built from long records. One 2016 study reconstructed 26 years of midge population dynamics from egg remains preserved in a pair of lake sediment cores Einarsson and coauthors, identifying consumer-resource population dynamics using paleoecological time series.
Consumer-resource interactions and energy flow
Primary consumers sit between producers and predators. Their numbers depend on how much food is available, and their grazing pressure shapes producer populations in turn. Tracking both sides helps explain why a population rises or crashes.
Watch out: a consumer population that looks stable can hide a shrinking food supply. Always record resource data alongside consumer counts.
Choosing the Right Primary Consumer Data for Your Research Question
Before you collect anything, decide what question the data must answer. The right dataset depends on whether you want to describe a snapshot, track a trend, or test a cause.
Use these questions to narrow your choice:
- Do I need a one-time count or repeated measurements over time?
- Is my goal to compare sites, or to follow one site through change?
- Do I need to link consumers to their food sources?
Ecology research uses three complementary approaches: theoretical ecology, statistical tests and models, and experimental ecology Krebs, Population and community ecology: past progress and future directions. Your question should point you toward one or more of these. A descriptive question calls for survey data. A causal question usually needs experimental or long-term observational data.
Ecological Population Sampling Methods for Primary Consumers
Sampling is where most population datasets are won or lost. A method that is easy to run but misses rare species will bias every number that follows. The goal is not the cheapest count, it is a count whose bias you can measure and whose effort you can defend.
Match the method to the consumer
- Sessile or slow-moving consumers (mussels, aphids, gall-formers): quadrat counts on a fixed area. Stratify by habitat type and record percent cover so density is comparable across plots.
- Mobile terrestrial invertebrates (ground beetles, grasshoppers): pitfall traps or sweep nets. Pitfall catch depends on activity, not just abundance, so pair it with a mark-recapture or removal estimate if you need absolute numbers.
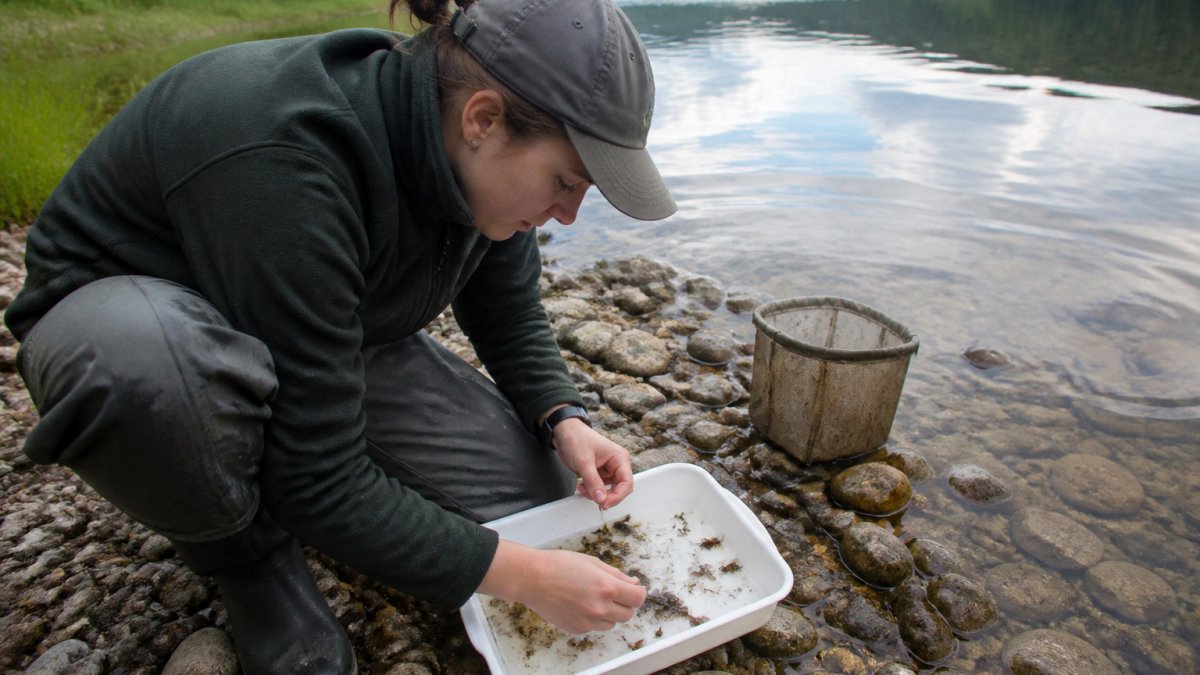
- Aquatic macroinvertebrates: kick-net or Surber sampling in riffles, D-frame nets in pools. Report the sampled area or volume; a ‘kick sample’ without area is not a density.
Design before you collect
- Define the population and the sampling frame. A frame that excludes a habitat type guarantees a biased estimate.
- Choose a probabilistic design, simple random, stratified, or systematic, so you can compute design-based estimates and standard errors.
- Pilot the effort. Run a small pilot to estimate variance, then size the sample so your confidence interval is narrow enough for the decision you need to make.
- Randomize or rotate sampling locations to avoid repeatedly sampling the same individuals.
- Record effort for every sample: trap-nights, sweep seconds, plot area, or survey distance. Without effort, counts cannot be compared.
Control the four biases that ruin counts
- Imperfect detection: you miss animals that are present. Distance sampling and occupancy models estimate detection probability directly; use them when the species is cryptic.
- Observer bias: different people count differently. Use a written protocol, calibrate observers on a shared set of samples, and rotate observers across sites.
- Uneven sampling effort: more effort in some sites or seasons skews totals. Standardize effort or model it explicitly as a covariate.
A single season of counts is a snapshot, not a trend. If your question is about change, plan for repeated sampling at matched intervals and expect autocorrelation between visits, see the next section.
Citizen science can scale collection at lower cost. One 2021 article describes it as a cost-efficient method for wildlife monitoring, though it does not give a specific dollar figure Sun and coauthors, citizen science data collection for integrated wildlife monitoring. Volunteer data needs clear protocols and observer calibration so that different people count the same way; without that, the extra volume adds noise rather than precision.
The table below summarises how common sampling methods match different primary consumers, as described in this section.
| Consumer type | Suggested method | Key note |
|---|---|---|
| Sessile or slow-moving | Quadrat counts | Record percent cover for comparability |
| Mobile terrestrial invertebrates | Pitfall traps or sweep nets | Pair with mark-recapture for absolute numbers |
| Aquatic macroinvertebrates | Kick-net or Surber sampling | Report sampled area or volume |
| Large or visible herbivores | Distance sampling or camera-trap grids | Corrects for imperfect detection |
| Preserved remains | Sediment cores and museum specimens | Long series, coarse temporal resolution |
Estimating Population Size in Ecology: Metrics and Methods
Raw counts rarely tell the full story. To estimate population size, you need a method that accounts for animals you did not see.
Start with the simplest metric that fits your design:
- Mean density across sampling units, multiplied by the total habitat area
- Capture-recapture estimates for mobile populations, which infer total size from marked and unmarked animals
- Index counts when absolute numbers are impractical, with the caveat that they track change rather than true size
Report which metric you used and why. A reader cannot judge your result without knowing whether it is a density, an index, or an estimate of total size.
Building a Consumer-Resource Population Model
A model links consumer numbers to resource availability. The simplest version tracks how consumer population changes depend on food supply and mortality.
A practical workflow looks like this:
- Define the consumer population and its resource, with clear units.
- Collect time-series counts for both, at matching intervals.
- Fit a simple model and check whether resource levels predict consumer change.
- Test the model against data it was not built from.
Keep the first model simple. A model with too many terms can fit past data perfectly and still predict poorly.
Data Quality, Sampling Bias, and Autocorrelation
Ecological time series have a common problem: each year’s count often depends on the year before. This is called autocorrelation.
The 2016 lake-core study explicitly used methods that account for both autocorrelation and measurement error Einarsson and coauthors, paleoecological time series analysis.
Watch for these errors:
- Observer bias: different people count differently
- Imperfect detection: you miss animals that are present
- Uneven sampling: more effort in some sites or seasons skews totals
Watch out: a short run of similar counts is not proof of stability. Autocorrelation can make a noisy series look calm.
Where to Find Datasets and Your Next Research Step
Finding usable primary-consumer data takes more than checking supplementary materials. Knowing where data lives, what each source is good for, and what access conditions to expect saves time. Use the table below as a starting point, then read the metadata before you download anything.
Federal and agency monitoring programs
- USGS (usgs.gov) publishes long-term wildlife and vegetation monitoring data, often through the National Water Quality Assessment and cooperative fish and wildlife research units. Look for data releases with DOIs, which are citable and versioned.
- EPA maintains the National Aquatic Resource Surveys (NARS), which sample benthic macroinvertebrates, primary consumers in streams and lakes, on a rotating national design. The raw counts and site metadata are downloadable, and the probabilistic design is documented, which matters if you want design-based estimates.
- USDA Forest Service Forest Inventory and Analysis (FIA) program provides plot-level vegetation data that can anchor producer-side resource estimates for forest herbivores.
Biodiversity and occurrence repositories
- GBIF (gbif.org) aggregates occurrence records, including many insect and herbivore surveys. It is excellent for presence and range questions, weaker for abundance, because most records are presence-only.
- iNaturalist and similar platforms feed research-grade observations into GBIF. Treat them as opportunistic, not designed, samples.
- NEON (National Ecological Observatory Network, neonscience.org) is the strongest single source for standardized, continental-scale primary-consumer data: ground beetles (carabids), mosquitoes, ticks, and small mammals are sampled on fixed protocols at sites across the country, with open data and documented QA/QC.
Literature-linked data
- Dryad, Zenodo, Figshare, and DataONE host supplementary datasets deposited with papers. Search by DOI or author rather than by keyword; metadata quality varies widely.
- PubMed and Web of Science records increasingly link to data availability statements. Read those statements before assuming a dataset is usable.
What to check before you download
- Design: Was sampling probabilistic, stratified, or opportunistic? Opportunistic data cannot support density estimates.
- Taxonomic resolution: Species-level counts are rare; genus or family totals change what questions you can ask.
- Effort: Trap-nights, sweep seconds, or plot area must be recorded, or counts are not comparable across sites.
- License: CC0 and CC-BY allow reuse with attribution; some agency data require a data-use agreement.
- Version and DOI: Cite the version you used so your analysis is reproducible.
Start with NEON or NARS if your question is about standardized, repeated sampling. Start with GBIF or iNaturalist if your question is about occurrence and range. Mixing the two without accounting for the design difference is the most common analysis error in this space.
If you want a faster route from raw data to a defensible answer, Accurate Market Research can help. Our team supports research project management and fieldwork, and we can help you scope a study so the data matches your question. Request a quote to discuss your project.
Frequently Asked Questions
What is the primary consumer in ecology?
A primary consumer is an organism that feeds directly on primary producers, typically plants or algae, and sits at the second trophic level of a food chain. Herbivores such as grazing insects, zooplankton, and many small mammals are common examples. Because they link producers to higher trophic levels, their population size strongly shapes energy flow through an ecosystem. Researchers therefore track primary consumer populations to understand how resources move through a food web and how changes at the base of the web ripple upward.
What do ecologists use to estimate population size?
Ecologists commonly use direct counts, quadrat or transect sampling, mark-recapture methods, and indices of abundance such as catch per unit effort. The choice depends on the organism’s mobility, the habitat, and the precision required. Mark-recapture is useful for mobile animals, while quadrat sampling suits sessile or slow-moving organisms. Analysts should report confidence intervals and document assumptions, since violations such as unequal capture probability can bias estimates.
How can primary consumer population data help explain energy flow in an ecosystem?
Combining primary consumer abundance with individual metabolic rates and body mass allows researchers to estimate how much energy herbivores extract from producers. Paired with producer biomass data, this shows how much plant production is consumed versus left to decay. Time-series data reveal whether consumption rates shift with seasons or climate conditions. Such calculations help test whether an ecosystem’s energy budget is balanced, and they clarify where energy is lost between trophic levels.
What happens if a primary consumer population decreases in an ecosystem?
A decline in primary consumers can reduce food available to predators and parasites, potentially lowering their numbers in turn. It can also allow producer populations to grow unchecked, changing vegetation structure and nutrient cycling. The effects depend on how many consumer species exist and how strongly each is linked to predators. Long-term population data help distinguish a natural fluctuation from a sustained decline that signals a structural change in the community.
